Key U.S. Multiple Myeloma Survival Rate Unchanged In Annual Cancer Statistics Update
By: The Myeloma Beacon Staff; Published: April 17, 2018 @ 5:49 pm | Comments Disabled
Updated multiple myeloma survival statistics for the United States were made public yesterday. The new data show little change in five-year survival compared to statistics released last year. This short-term plateau in myeloma survival stands in contrast to the sizable increases in survival seen in last year's update and the one in 2016.
The newly released statistics also show little change in how survival varies across myeloma patients based on their age, race, or gender. Age continues to have a significant effect on survival chances, with younger patients experiencing much higher survival rates than older patients, even when survival rates are adjusted to take into account patient age (as is the case with the recently release survival data). Differences in survival based on race or gender, on the other hand, are not substantial, as has been the case for the last several data updates.
The new survival statistics were released as part of the annual update done by the U.S. National Cancer Institute’s Surveillance, Epidemiology, and End Results (“SEER”) Program, which compiles and publishes cancer-related data for the United States. The data published by SEER are based on actual observations of survival, rather than estimates that combine historical data with models or subjective opinion. Because the results are based on actual survival, they are inherently dated. It is not possible to publish actual five-year survival results, for example, until five years of data have been accumulated, checked, and analyzed.
Although the SEER methodology results in survival rates that can seem dated, the statistics are nevertheless important. They provide a baseline for projecting what survival might be for patients diagnosed more recently. In addition, the way in which SEER survival rates change as innovations in cancer therapy occur can give further insight into what current survival rates may be.
The Latest Update And Long-Term Survival Trends
Discussions of cancer survival frequently focus on five-year survival. This is the survival statistic that the SEER program makes readily available for a wide range of cancers. To check whether survival for a particular type of cancer is changing over time, researchers calculate survival rates for patients diagnosed in different years. A plot of the survival rates by year of diagnosis quickly indicates whether survival is remaining the same, improving, or worsening.
The graph in Figure 1 is an example of such a survival plot. It shows SEER’s estimates for five-year survival among U.S. multiple myeloma patients, by year of diagnosis. It includes SEER’s latest survival estimate, which is for patients diagnosed in 2010. Prior to this year’s statistical update by SEER, the most recent five-year myeloma survival estimate for the U.S. was for patients diagnosed in 2009.
Five-Year Relative Survival of U.S. Multiple Myeloma Patients
By Year of Diagnosis

Source: Surveillance, Epidemiology, and End Results (SEER) program website, April 16, 2018
The latest SEER survival update reveals that there was little change in the five-year survival of myeloma patients diagnosed in 2010 versus those diagnosed in 2009. The five-year relative survival was 52.9 percent for patients diagnosed in 2009 and 53.0 percent for those diagnosed in 2010.
Survival increased noticeably, on the other hand, from 2007 to 2008, and again from 2008 to 2009. Survival also climbed regularly throughout the first five years of this century.
Most researchers believe that the improvements in myeloma survival that have taken place over the past 15 to 20 years have been due to the introduction of new drugs to treat multiple myeloma. The initial survival improvements were due to the introduction of thalidomide, Velcade (bortezomib), and Revlimid (lenalidomide). Survival increases in later years were most likely due to the introduction of Kyprolis (carfilzomib) and Pomalyst (pomalidomide, Imnovid), which received regulatory approval in the United States in 2012 and 2013, respectively.
After the approval of Pomalyst in 2013, there was a lull in U.S. approvals of new myeloma therapies until 2016, when four new drugs were given the okay by the U.S. Food and Drug Administration: Darzalex (daratumumab), Empliciti (elotuzumab), Ninlaro (ixazomib), and Farydak (panobinostat).
The lull in approvals from 2013 to 2016 could very well be the reason for the pause in myeloma survival improvements seen in the survival data released yesterday.
The approval lull also could mean that survival updates next year, and in 2020, also may show only modest survival improvements until the full effect of the 2016 approvals can be seen in the five-year survival results.
Importantly, due to the approvals in 2016 and those likely to come in the next several years, people diagnosed with multiple myeloma in 2018 may have five-year survival rates as high as 65 or 70 percent.
Relative vs. Absolute Survival Rates
The survival rates published by SEER are relative survival rates. These are different than the survival rates typically seen in myeloma research articles, which are absolute survival rates.
It is common in myeloma research studies to find statements such as "The five-year survival rate was 60 percent." This (absolute) survival rate means that, five years after their myeloma diagnosis, 60 percent of the patients in the study were still alive.
The 60 percent absolute survival rate, however, does not put the survival experienced by the myeloma patients into perspective. The absolute rate does not say how the survival of patients over the course of the five years compared to the survival of people in the general population who have the same age, gender, and ethnicity.
Relative survival rates, on the other hand, provide such perspective. To put it bluntly, relative survival rates take into account that people without a disease such as multiple myeloma also die.
The relative survival rate is calculated by dividing the absolute survival rate for a group of cancer patients by the absolute survival rate for a similar group of people from the general population.
As an example, take the (fictitious) research study mentioned earlier with the 60 percent absolute five-year survival rate. Assume that a large group of people similar in age, gender, and race to those in the study, but from the general population, would have experienced an 80 percent absolute survival rate over the same five-year period.
In that case, the relative survival rate of the myeloma patients in the study would be 75 percent (60/80=0.75, or 75 percent).
Absolute and relative survival rates will be very similar for younger myeloma patients, because younger people from the general population do not die that often. Relative survival rates for older myeloma patients, on the other hand, will be higher than their corresponding absolute survival rates.
Survival By Age At Diagnosis, Race, and Gender
Yesterday’s SEER statistical update also included new 2010 five-year cancer survival rates by age, race, and gender. These results make it possible to plot updated summaries of five-year multiple myeloma survival by age (see Figure 2 below), race (Figure 3), and gender (Figure 4).
The updated survival results by age at diagnosis show that whether someone with myeloma is old or young continues to have a significant impact on their prognosis.
Five-Year Relative Survival of U.S. Multiple Myeloma Patients
By Age At Diagnosis And Year of Diagnosis

Source: Surveillance, Epidemiology, and End Results (SEER) program website, April 16, 2018
Both relative and absolute survival rates are substantially higher for younger myeloma patients in comparison to older patients. This pattern was unaltered in the 2010 results that were made available yesterday. From 2009 to 2010, however, there was a slight improvement in relative survival in older myeloma patients, whereas relative survival dipped slightly in younger patients. It is doubtful, though, whether any of these minor changes from 2009 to 2010 are statistically significant.
(For readers interested in hard numbers, the five-year relative survival in 2010 by age group was: 76.9 percent for those aged 20-49 at diagnosis, 61.2 percent for those aged 50-64 at diagnosis, 53.6 percent for those 65-74 years old at diagnosis, and 35.3 percent for those 75 and older at diagnosis.)
In the case of myeloma survival by race and gender, the new results for 2010 do not alter the survival patterns seen in 2009. Neither race nor gender has a sizable impact on a myeloma patient’s relative survival in either year.
Five-Year Relative Survival of U.S. Multiple Myeloma Patients
By Race And Year of Diagnosis
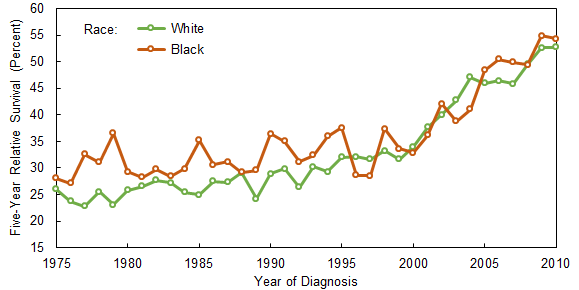
Source: Surveillance, Epidemiology, and End Results (SEER) program website, April 16, 2018
Historically, black myeloma patients have usually had higher five-year survival rates than white myeloma patients, and the black survival rates in 2009 and 2010 were higher than the white rates. But the survival rate differences in those years were not especially large: 54.9 percent versus 52.6 percent in 2009, and 54.3 percent versus 52.7 percent in 2010.
(The “white” and “black” race designations in Figure 3 and in this article are based on the “White (includes Hispanic)” and “Black (includes Hispanic)” designations used by SEER in its data summaries.)
Gender does not appear to have played a significant role in myeloma survival rates during the 1970s and 1980s, but male survival rates started to outpace female rates in the 1990s. The gender gap in survival rates narrowed during the early 2000s, and was negligible in both 2009 and 2010. In both those years, however, the male five-year survival rate was slightly higher than the female rate (53.5 percent versus 52.2 percent in 2009, and 53.7 percent versus 52.2 percent in 2010).
Five-Year Relative Survival of U.S. Multiple Myeloma Patients
By Gender And Year of Diagnosis
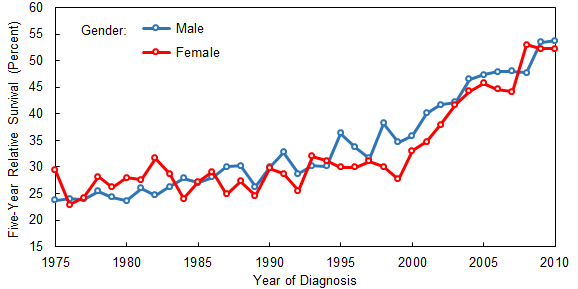
Source: Surveillance, Epidemiology, and End Results (SEER) program website, April 16, 2018
Article printed from The Myeloma Beacon: https://myelomabeacon.org
URL to article: https://myelomabeacon.org/news/2018/04/17/key-u-s-multiple-myeloma-survival-rate-unchanged-in-annual-cancer-statistics-update/
Click here to print.